
Joseph Daniel
Data Analyst | Business Intelligence Expert | SQL Database Management
Gain deeper insight into my professional background in Data Analysis, Data Visualization, and Business Intelligence by downloading my resume. It outlines my skills, experience, and contributions to high-impact projects.Return to Home Page
Sales Performance Analysis Dashboard
Project Overview
This project was undertaken to support the Sales Director of Nova Retail in making data-driven strategic decisions. As the Data Analyst, I was responsible for transforming raw sales data into meaningful insights through comprehensive analysis and visualization.The scope of the project involved calculating key financial metrics such as total sales, profit, and cost, as well as identifying trends across products, regions, and time periods. I conducted a detailed performance analysis to uncover high-performing areas, underperforming segments, and opportunities for revenue growth.Tools & Technologies
• Excel
• Power BI
• DAX (Data Analysis Expressions)KPIs
Total Revenue
Total Profit
Total Order
Profit MarginSlicers
• Month
• Region
• Product Category
• Sales Team
• State
Dataset DescriptionThe dataset includes transactional sales records with the following key fields:Order ID
Product Category
Region
Sales Amount
Quantity Sold
Sales Representative
Order DateData was cleaned and modeled to enable accurate calculations and interactive reportingSales Overview
What this shows:
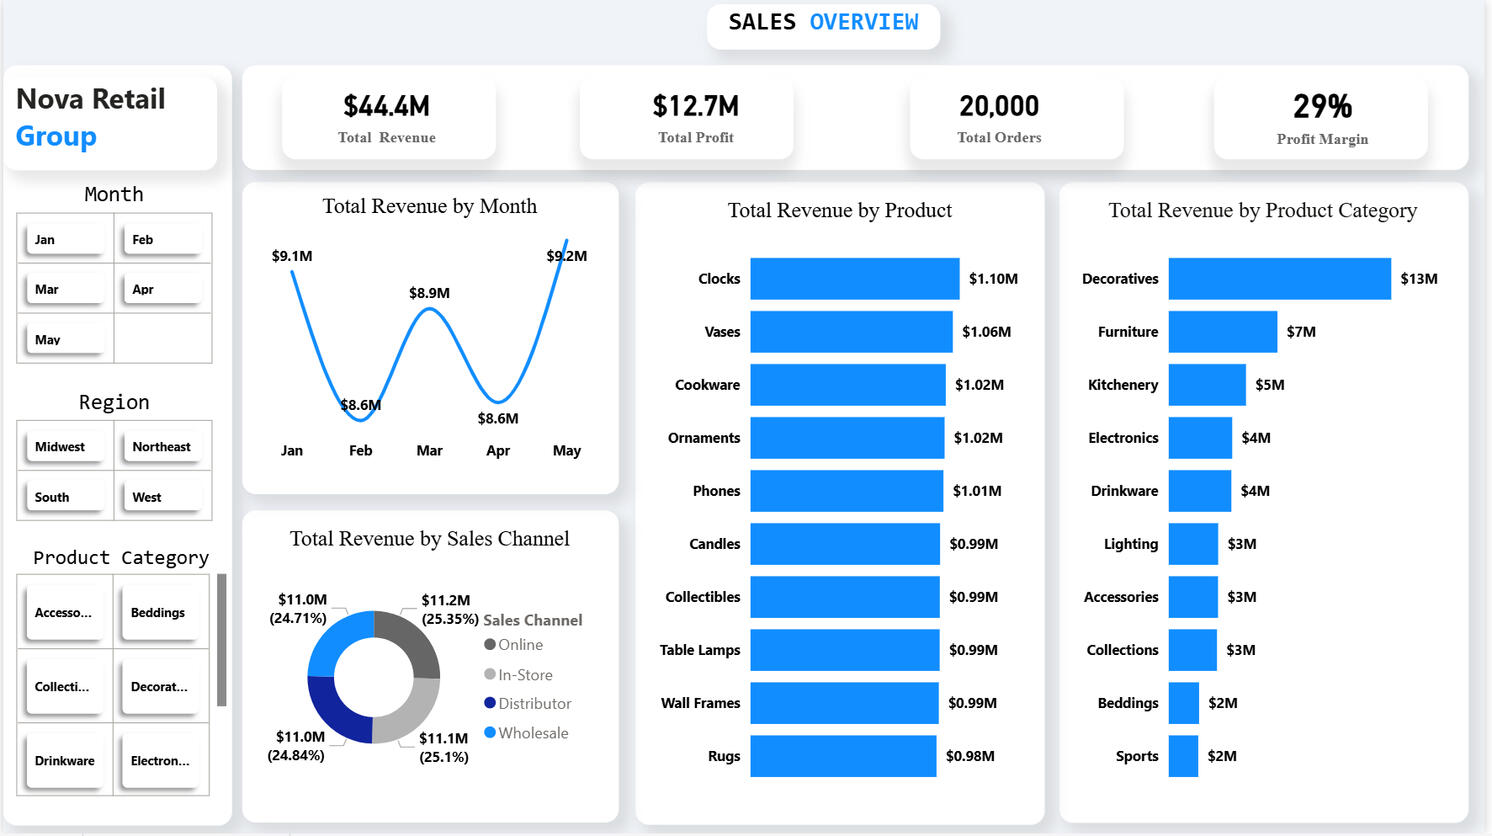
This page provides a high-level overview of overall sales performance, sales volume, and overall trends, including key performance index such as total revenue, total sales, total profit, total orders, and profit margin.Key Insights:
• Key KPIs highlight the general health of the business
• There is notable volatility in monthly sales performance, characterized by alternating increases and decreases
• All four sales channels contribute nearly equally, each representing about one-quarter of total sales, indicating a well-balanced channel mix
• Revenue by product shows a tight distribution, with each successive product contributing only slightly less than the previous one
• Revenue concentration is high in the Decorative category ($13M), indicating a strong dependency, while other categories contribute comparatively modest and closely grouped revenues ($2M–$7M)Product Analysis
What this shows:
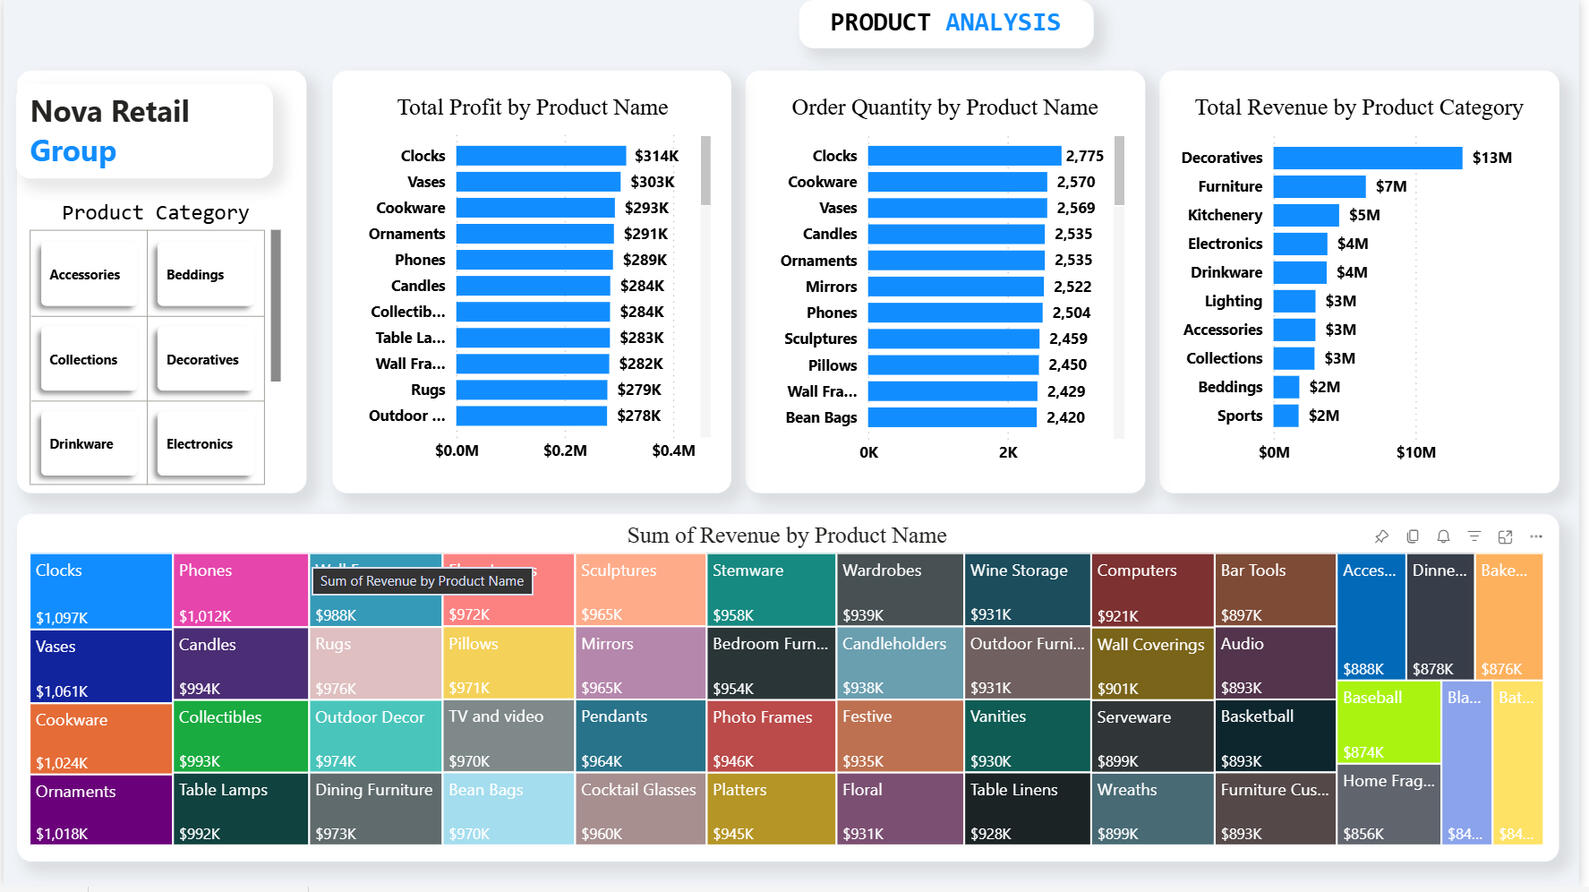
This page evaluates product-level performance, identifying top-selling and low-performing productsKey Insights
• Profit performance is tightly distributed across products, with Clock leading marginally at $314K and the remainder ranging narrowly from $278K to $303K
• Clock is the top-performing product by order quantity at 2,775 units, standing above a tightly clustered range of 2,118–2,570 units for other products, indicating a clear demand outlier.
• Revenue concentration is high in the Decorative category ($13M), indicating a strong dependency, while other categories contribute comparatively modest and closely grouped revenues ($2M–$7M)Sales Team Performance
What this shows:
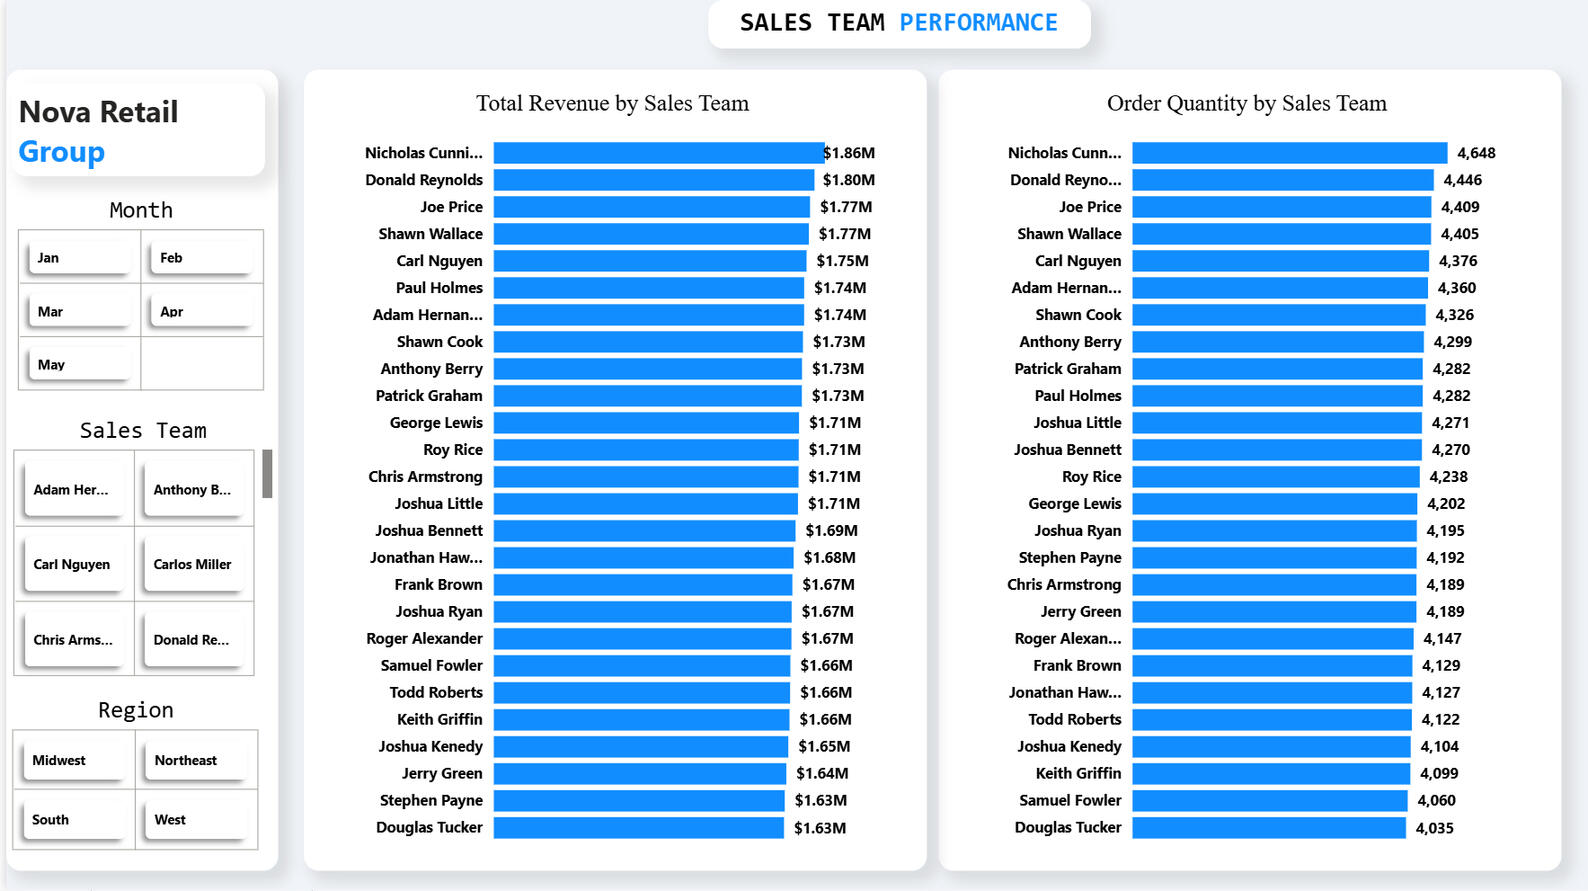
This section compares sales representatives based on performance, revealing top contributors and those who may need support.Key Insights
• Nicholas Cunningham ($1.86m) and Donald Reynolds ($1.80m) lead total revenue by sales team, but performance across the board is tightly clustered between $1.63m and $1.77m, indicating minimal variance and a highly competitive, evenly distributed revenue landscape
• Order quantities by sales member show only marginal differences, declining gradually down the ranking, which indicates a fairly even distribution of sales activity with no significant outliersGeographical Sales
What this shows:
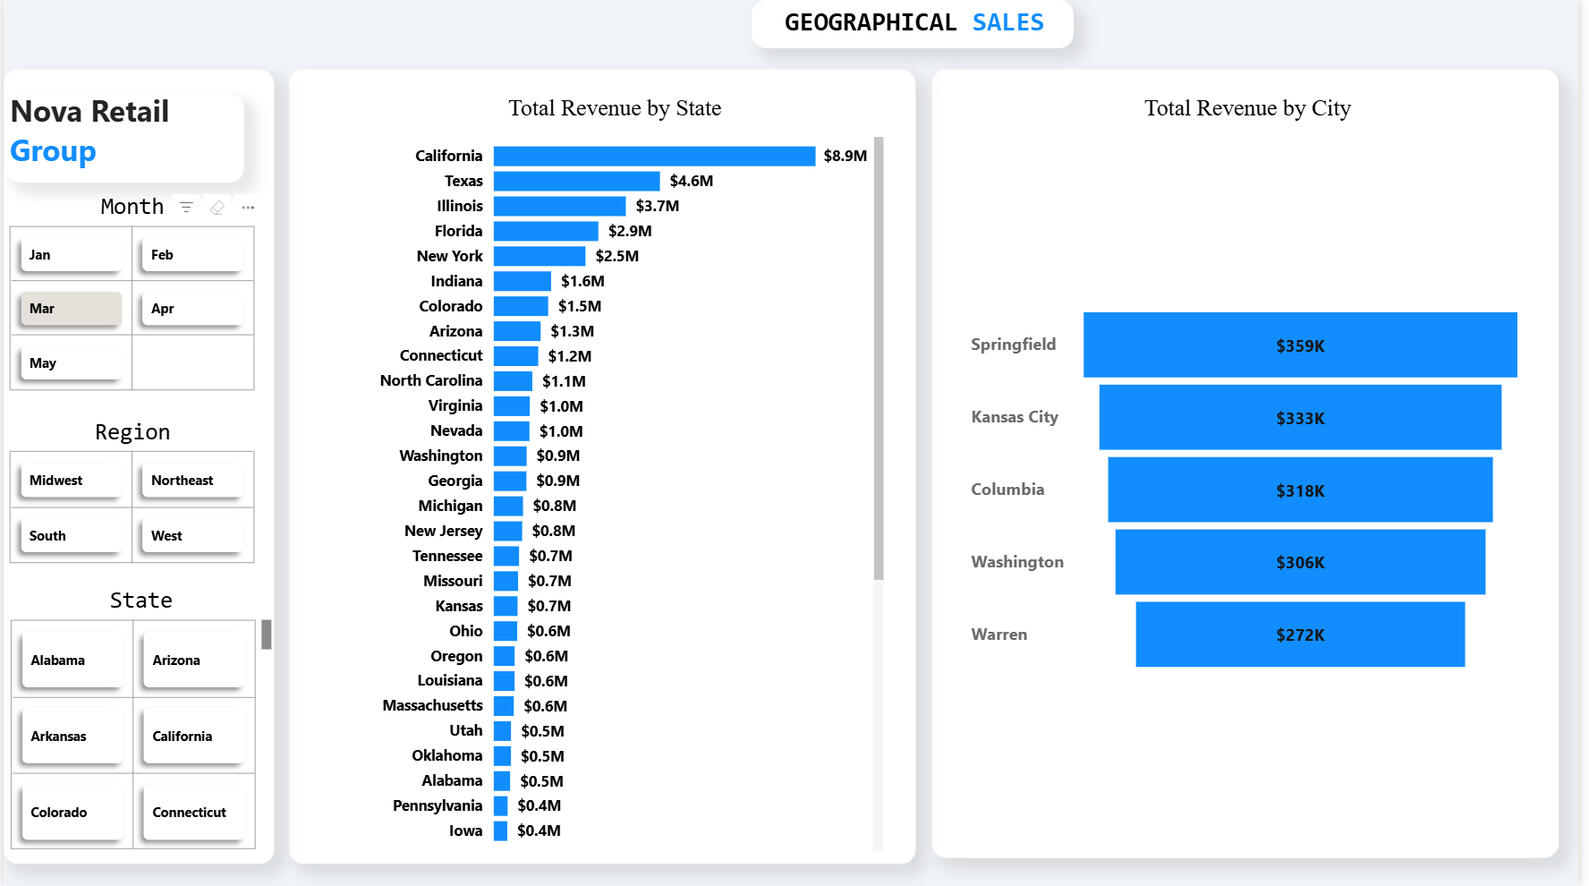
California is the dominant revenue driver, contributing 20% of total sales, well ahead of any individual state, while the remaining 45 states collectively account for 80%, indicating a high geographic concentration in a single leading marketKey Insights
• With California contributing 20% of total revenue and most other states below 10%, revenue is highly concentrated, suggesting significant untapped growth potential across underperforming states
• Revenue is evenly distributed across the top cities, with only an $87k gap between first and fifth place, indicating balanced performance but no clear market leader to anchor growthDrill-Through
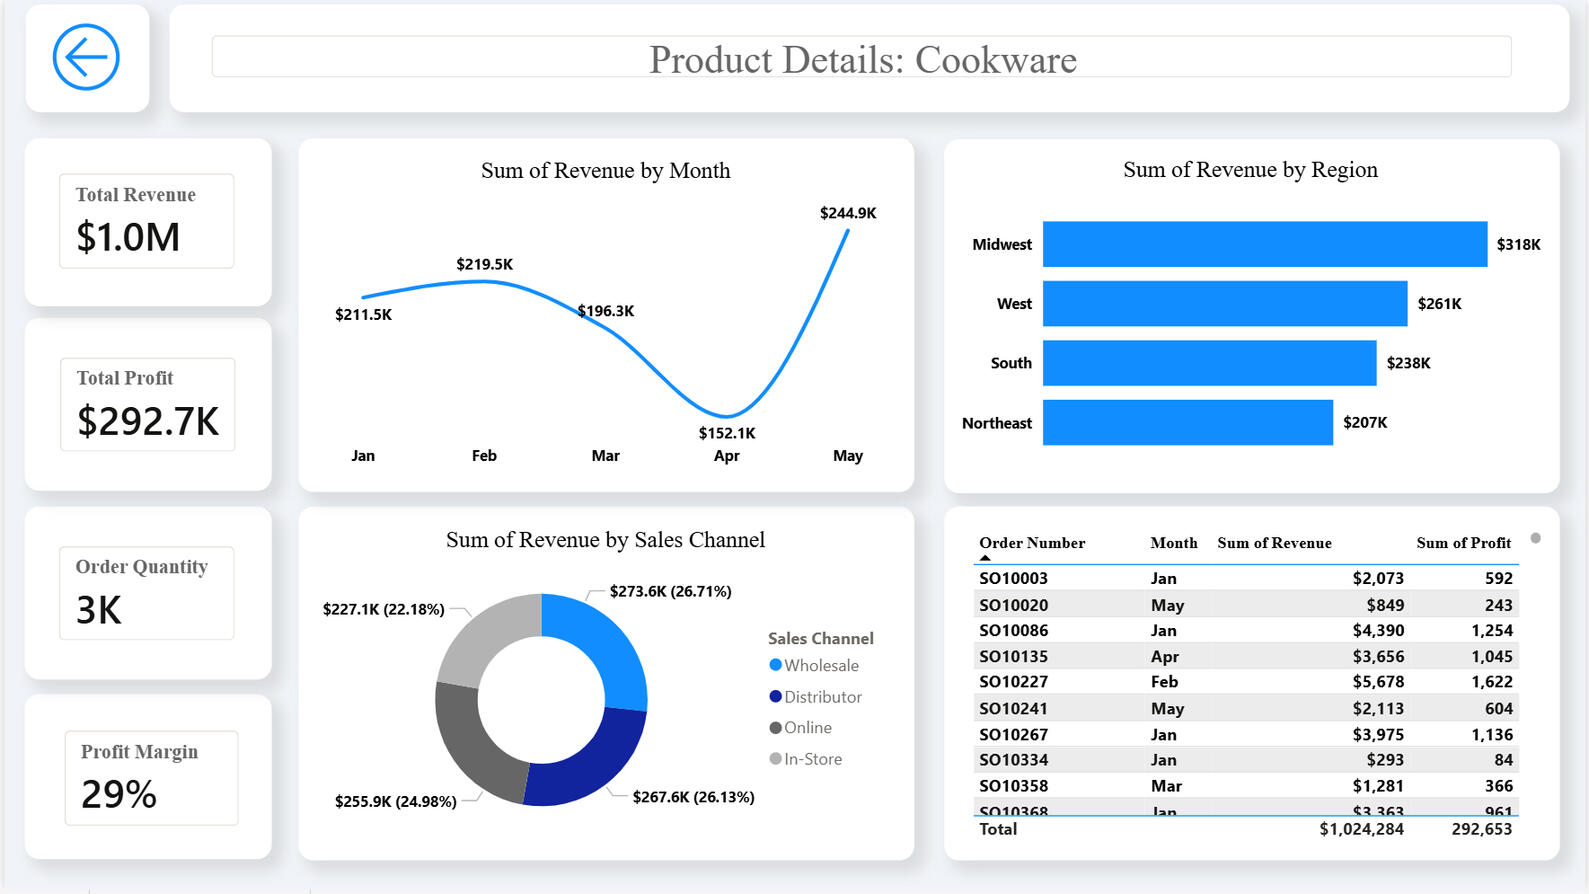
What this shows:
This drill-through page provides a detailed, filtered view of sales data based on a selected item (such as a specific product, region, or sales representative). It allows users to move from a high-level overview to a deeper level of analysis for more precise insightsRecommendations
• Focus on expanding high-performing regions to maximize revenue
• Investigate and improve underperforming regions
• Promote and invest in top-selling products
• Provide training and support for lower-performing sales representatives
• Diversify product offerings to reduce dependency on a few key itemsConclusion
This analysis provides a comprehensive view of sales performance and highlights critical areas for improvement. By leveraging these insights, the business can optimize its sales strategy, improve team performance, and drive sustainable revenue growth
_______________________________________________________________________________________________________________________________________________
HR Workforce Analytics Dashboard
Project Overview
This project focuses on analyzing workforce data to uncover key insights into employee distribution, compensation structure, and recruitment trends. Using Power BI, the dashboard transforms raw HR data into interactive visualizations that support informed decision-making.The analysis aims to identify patterns in workforce composition, highlight potential disparities in salary across departments, and track hiring activity over time. By providing a clear and data-driven view of HR metrics, this dashboard enables organizations to optimize workforce planning, improve compensation strategies, and enhance overall operational efficiencyTools & Technologies
• Excel
• Power BI
• DAX (Data Analysis Expressions)KPIs
• Total Employees
• Average Salary
• Average Age
• Total Department
• Total CountriesSlicers
• Gender
• Country
• Business Unit
• Department
• Job Title
• Hire Year
• Hire Month
• Ethnicity
• Age GroupDataset DescriptionThe dataset contains employee-level HR records, including:Employee ID
Department
Gender
Salary
Job Role
Hiring DateThe data was cleaned and transformed to enable accurate reporting and analysisWorkforce Overview
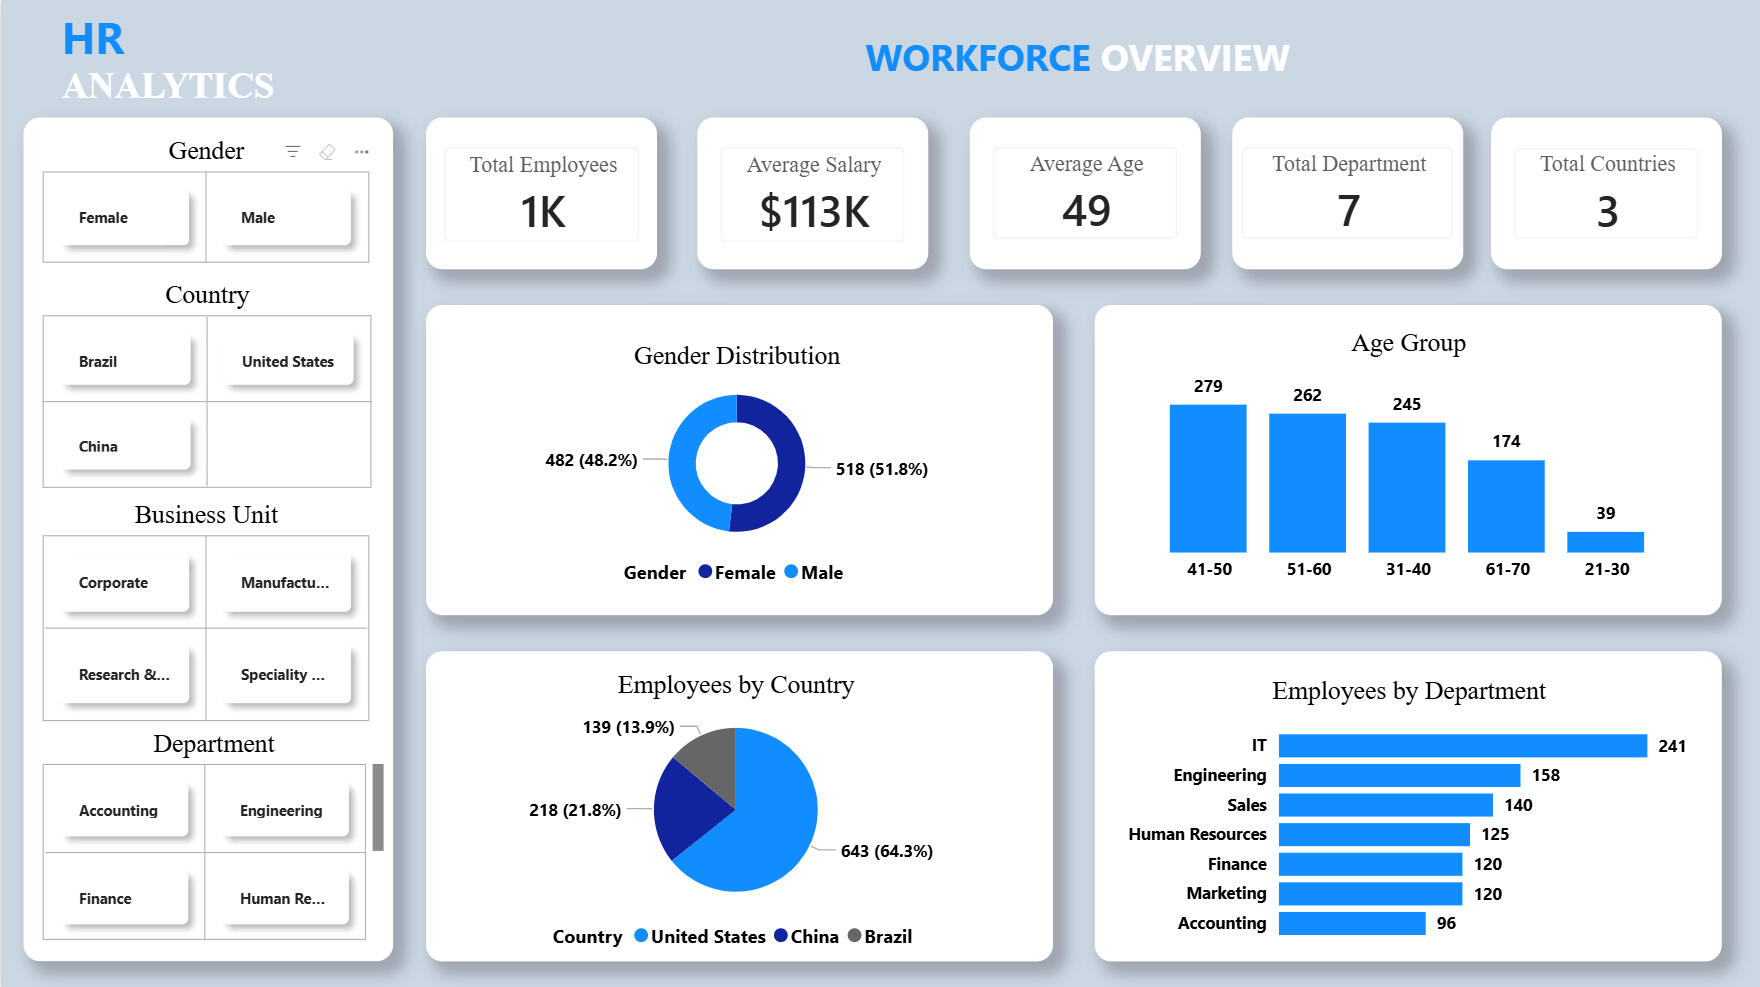
What this shows:
This page provides a high-level summary of the workforce, including employee distribution by gender, age group, country, and department.Key Insights:• A significant portion of employees are concentrated in a few key departments
• Gender distribution shows balance in almost all areas
• Over 50% of employees come from a single country, indicating a heavily concentrated workforce
• Workforce composition is not evenly spread across the organizationSalary Analysis
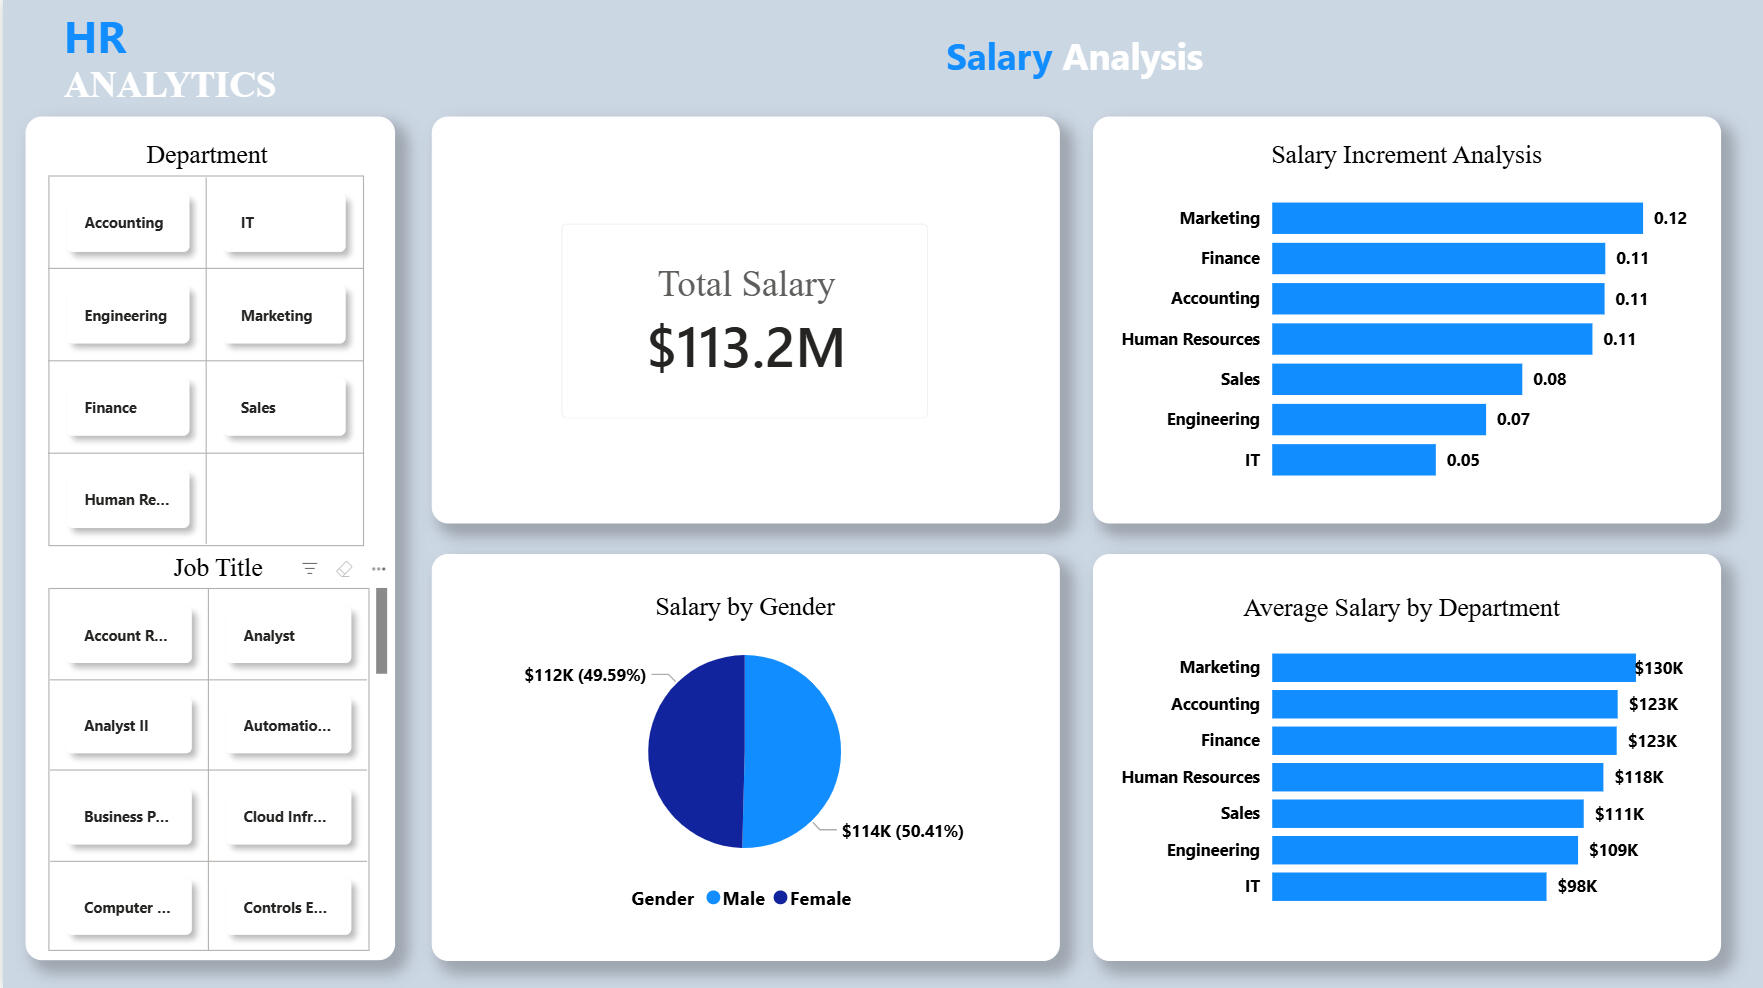
What this shows:
This section analyzes salary distribution across departments and roles, highlighting variations in compensationKey Insights:• Noticeable salary gaps exist between departments
• Some roles receive significantly higher average compensation
• Salary gap between gender is slightly unequal
• Potential inconsistencies in pay structure across similar rolesHiring Trend
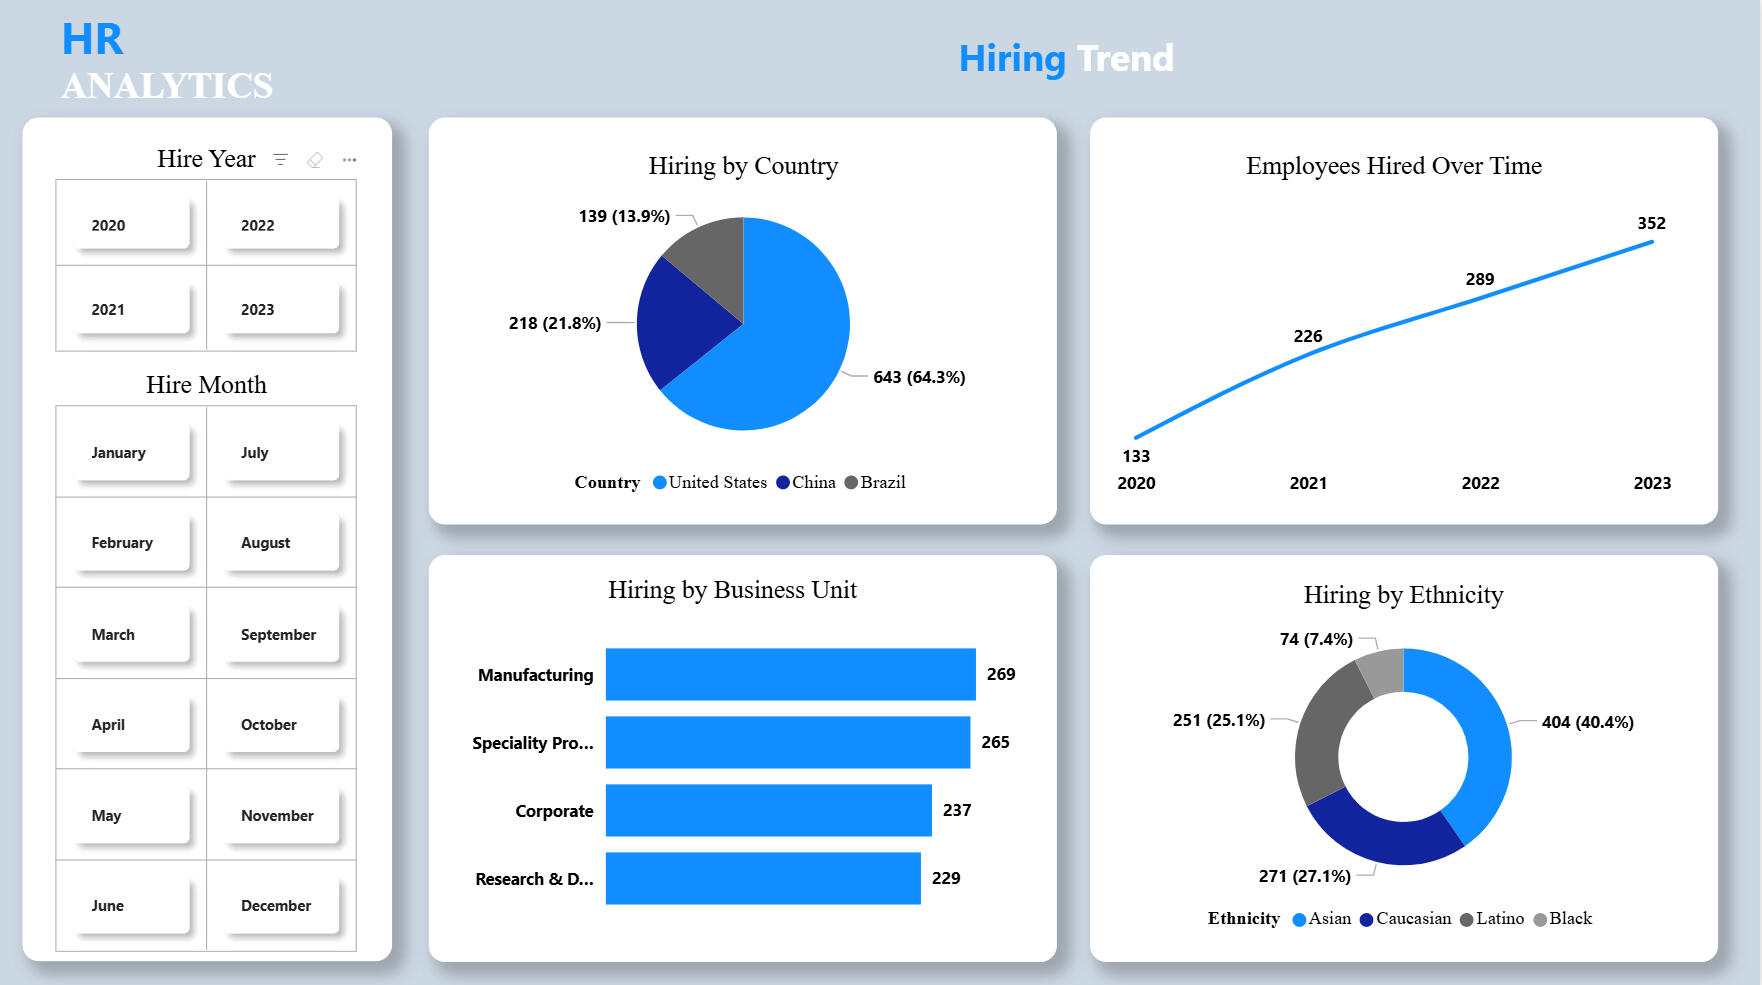
What this shows:
This page tracks hiring activity over time, identifying trends and seasonal patterns in recruitmentKey Insights:• Hiring trend overtime has been on the increase
• Recruitment is inconsistent across months
• Hiring composition is not evenly spread across the countriesWorkforce Demographics
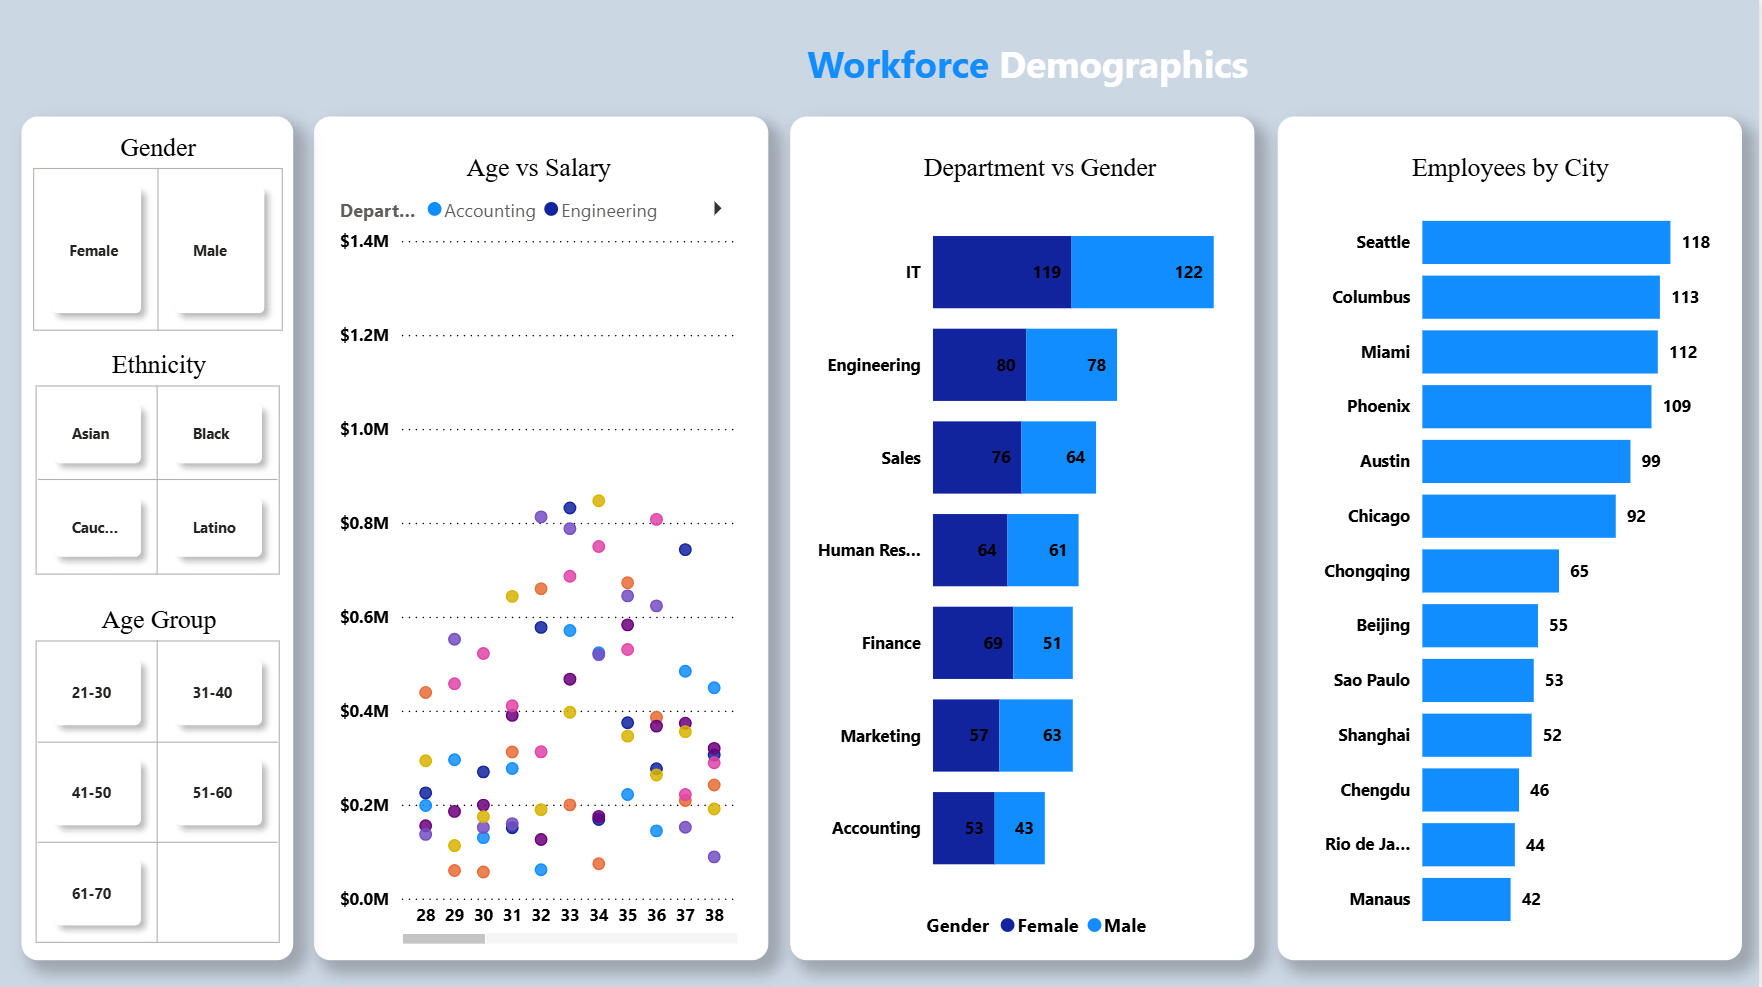
What this shows:
This page tracks hiring activity over time, identifying trends and seasonal patterns in recruitmentKey Insights
• Workforce distribution is uneven across departments
• Gender imbalance exists in parts of the organization
• Salary disparities suggest potential inequities in compensation
• Hiring patterns are inconsistent and may not align with workforce needsDrill-Through
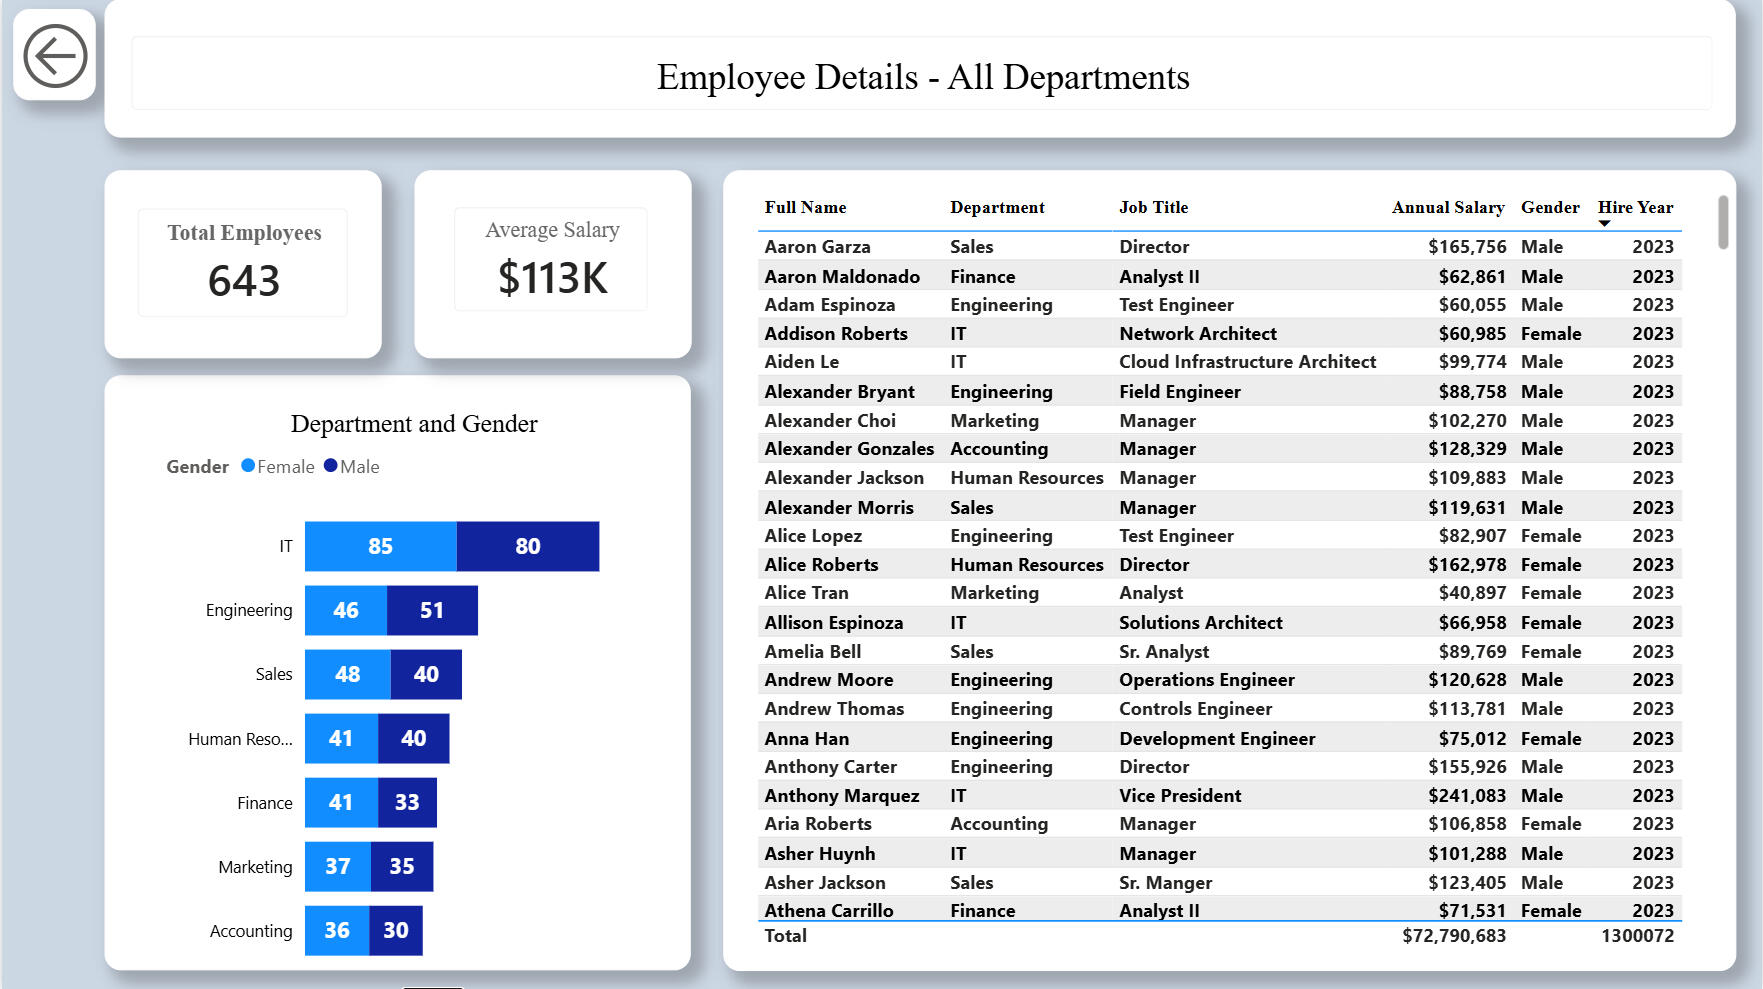
What this shows:This drillthrough page provides a detailed, employee-level view of HR data based on a selected category such as department, job role, or individual employee. It enables users to move from a high-level summary to a more granular analysis of workforce metrics, including salary, role distribution, and employee attributesKey Insights:
• Specific departments reveal differences in employee composition and structure
• Salary variations become more visible at a detailed level
• Individual employee data helps identify patterns not obvious in summary views
• Certain roles or departments may show concentration of higher or lower compensationRecommendations
• Redistribute workforce to ensure balanced departmental capacity
• Review and standardize salary structure to ensure fairness
• Implement consistent hiring strategies aligned with business demand
• Monitor workforce diversity and inclusion metrics more closelyConclusion
This analysis highlights critical workforce trends and provides actionable insights to improve organizational efficiency. By leveraging data-driven decision-making, HR teams can better manage talent, optimize compensation, and plan recruitment strategies effectively_______________________________________________________________________________________________________________________________________________
AK TECHNOLOGY – Sales & Performance Dashboard
Project Overview
Project OverviewThis project focuses on analyzing sales and operational performance data for AK Technology, a tech-commerce company. The objective is to design an interactive dashboard that provides visibility into key business metrics such as revenue, cost, profit, and sales volume.Using Power BI, the dashboard transforms raw transactional data into actionable insights, enabling stakeholders to monitor performance trends, evaluate product demand, and make data-driven decisions.Business Unit
The goal of this analysis is to:• Track overall business performance
• Understand sales trends over time
• Identify top-performing products
• Analyze customer purchasing behavior
• Enable dynamic filtering for deeper insightsDataset Description
The dataset contains transactional sales records with key fields such as:• Product
• Customer
• Sales Amount
• Cost
• Profit
• Quantity Sold
• Order DateData was cleaned and structured to ensure accurate aggregation and reportingTools & Technologies
• Power BI
• Microsoft Excel
• DAXKey Performance Indicators (KPIs)
• Total Sales
• Total Cost
• Total Profit
• Total Quantity SoldThese KPIs provide a quick snapshot of overall business performancePerformance Overview
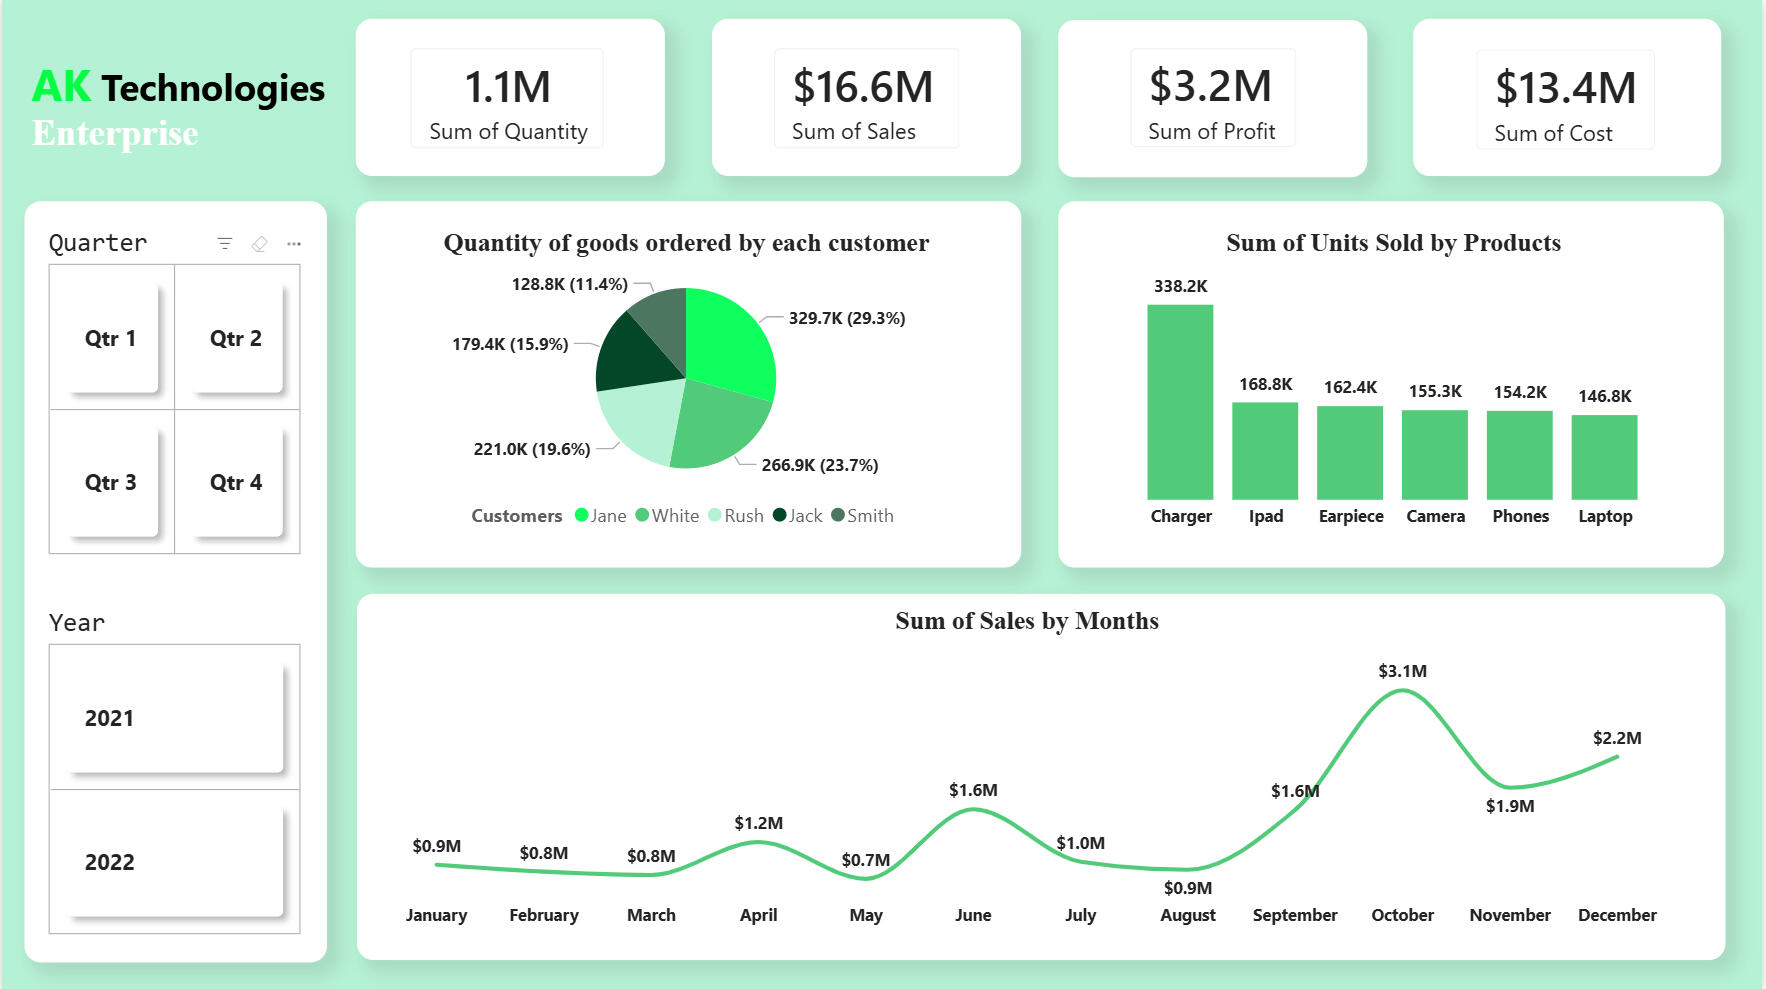
What this shows:This dashboard provides a comprehensive overview of AK Technology’s business performance, highlighting key financial metrics, product demand, and customer purchasing behavior. It enables users to monitor trends and interactively filter data for deeper analysis.Key Insights
• Sales performance varies across months, indicating possible seasonal trends
• A small number of products contribute significantly to total units sold
• Few customers contribute largely in terms of quantity of units purchased
• Sales peaked the highest in the last quarter of the year
• Profitability depends on the balance between cost and sales across productsRecommendations
• Focus on high-performing products to maximize revenue
• Analyze underperforming products to improve or phase them out
• Strengthen relationships with high-value customers
• Optimize cost management to improve profit margins
• Leverage peak sales periods for strategic promotionsConclusion
The dashboard provides a clear and interactive view of business performance, enabling AK Technology to make informed decisions based on sales trends, product demand, and customer behavior. By leveraging these insights, the company can improve operational efficiency and drive sustainable growth______________________________________________________________________________________________________________________________________________
INTERNATIONAL BREWERIES – Sales & Performance Analysis
Project Overview
This project analyzes sales and operational data from the Ota branch of International Breweries Plc.The objective is to evaluate brand performance, sales trends, and sales representative effectiveness, while uncovering insights that can support strategic decision-making within the organization.Using Power BI, the dashboard transforms raw sales data into an interactive business report for performance monitoring and analysis.Business Objective
The goal of this analysis is to:• Measure brand performance and customer patronage
• Track overall sales, cost, and profitability
• Evaluate sales representative performance
• Identify peak and low sales periods
• Enable dynamic filtering by time and regionDataset Description
The dataset contains transactional sales data with key fields such as:• Brand
• Sales Representative
• Country
• Region
• Sales Amount
• Cost
• Profit
• Quantity
• DateData was cleaned and structured to support accurate aggregation and reportingTools & Technologies
• Power BI
• Microsoft Excel
• DAXKey Performance Indicators (KPIs)
• Total Sales
• Total Cost
• Total Profit
• Total Quantity Sold
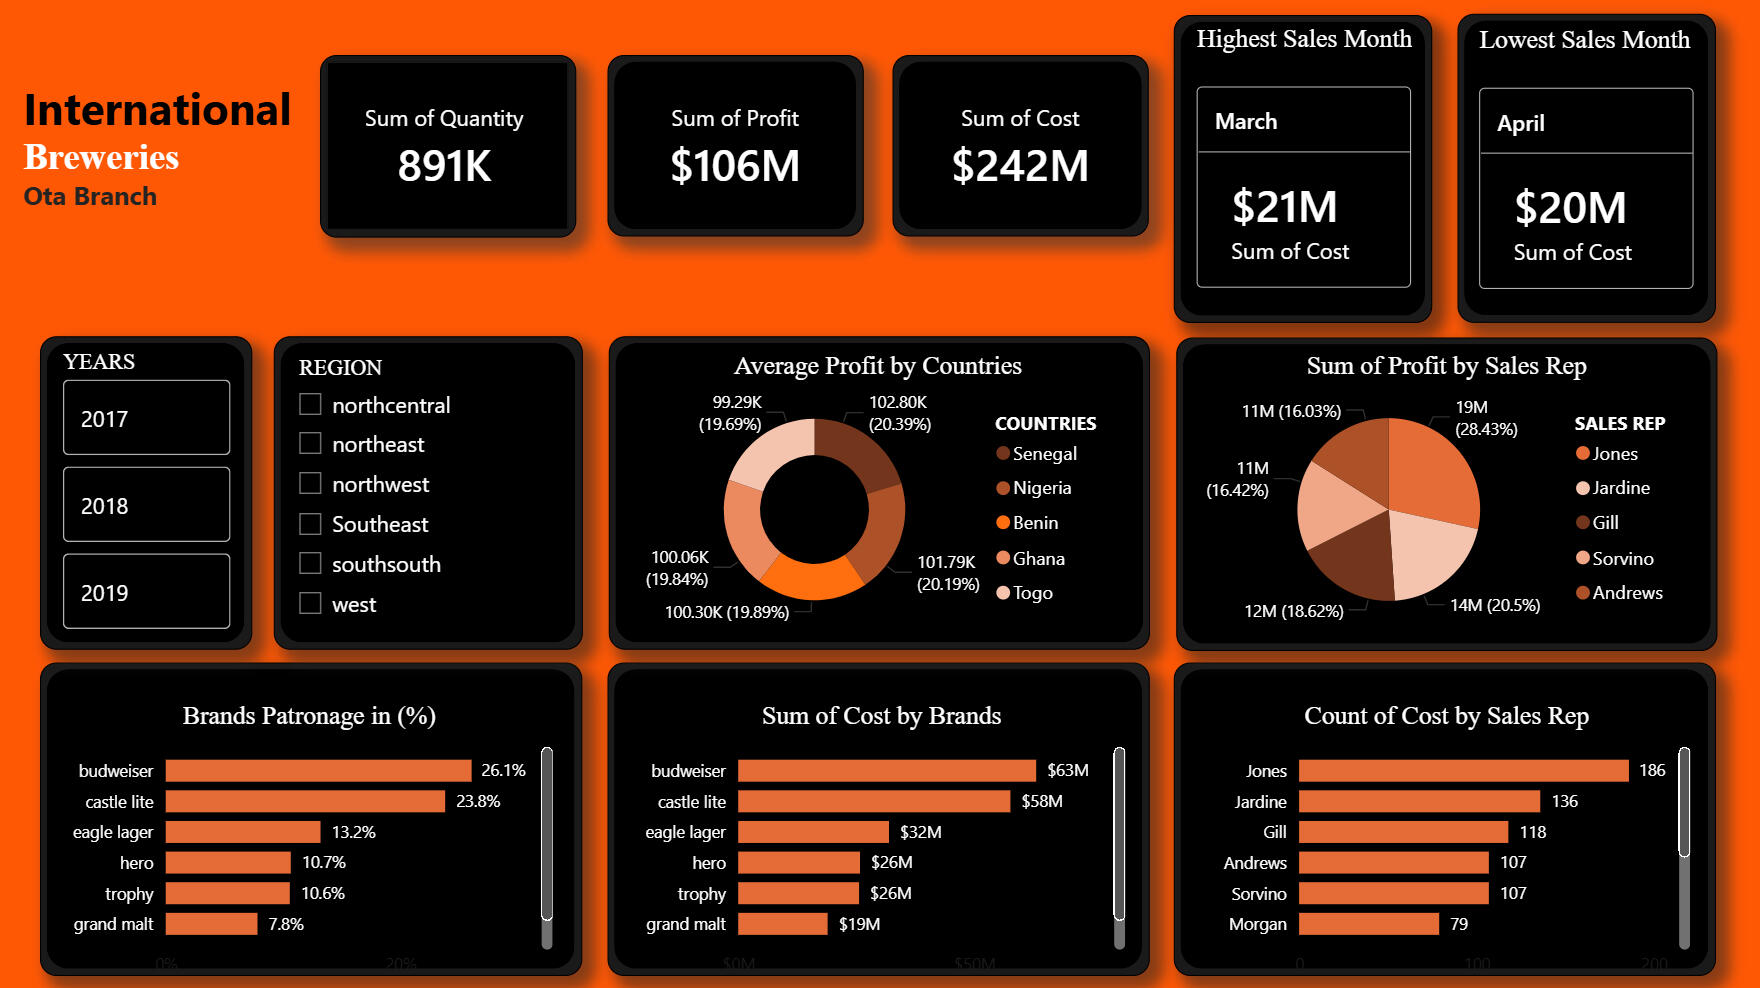
What this shows:This dashboard provides a comprehensive overview of sales performance, brand contribution, and profitability across regions and sales representatives. It enables users to analyze business performance at both summary and detailed levelsKey Insights
• A few brands dominate overall sales and customer patronage
• Profitability slightly varies across countries, indicating regional performance differences
• Sales activity is uneven among sales representatives with a few outperforming the rest by a huge gap
• Certain months record peak sales, suggesting seasonal demand patterns
• Top-performing sales reps contribute significantly to total profitRecommendations
• Focus on expanding high-performing brands to maximize revenue
• Investigate underperforming regions to identify growth opportunities
• Reward and replicate strategies of top-performing sales representatives
• Align inventory and marketing efforts with peak sales periods
• Optimize cost management to improve overall profitabilityConclusion
This analysis provides a data-driven view of business performance across brands, regions, and sales teams. By leveraging these insights, International Breweries can enhance decision-making, improve operational efficiency, and drive sustained growth